8.4 Statistical Test for Difference of Population Means
Our last (!) test applies to differences of means. Such tests are very common when you conduct a study involving two groups. In many medical trials, for example, subjects are randomly divided into two groups. One group receives a new drug, the second receives a placebo (sugar pill). Then the researcher measures any differences between the two groups.
Fortunately, we know how to do Hypothesis testing, and in this case we will exclusively use Excel to perform the caluclations for us. Here is the setup for this test:
- Null Hypothesis: two means M1 and M2 differ by a fixed amount c, i.e. M1 - M2 = c
- Alternative Hypothesis: the two means M1 and M2 do not differ by the amount c, i.e. M1 - M2 not equal to c (2-tail)
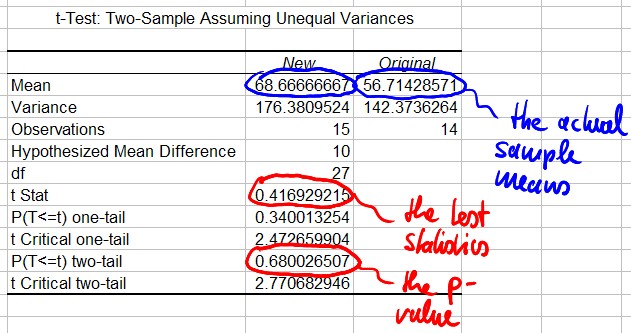
- Test Statistics: as computed by Excel
- Rejection Region: probability as computed by Excel
Example 1: Two procedures to determine the amylase in human body fluids were studied. The "original" method is considered to be an acceptable standard method, while the "new" method uses a smaller volume of water, making it more convenient as well as more economical. It is claimed that the amylase values obtained by the new method average at least 10 units greater than the orresponding values from the orignal method. A test using the original method was conducted on 14 subjects, the test with the new method on 15 subjects, giving the data displayed in the table below. Test the claim at the 1% level.
We need to be careful as to which variable is the first and which is the second one. In our example we want to test whether the average for the new method is 10 units larger than the old average. Since our procedure always tests M1 - M2 we have to pick as M1 the "new method" data and as M2 the "original method" data. With those choices for M1 and M2 the statistical test corresponding to our example is setup as follows:
Original New 38 46 48 57 58 73 53 60 75 86 58 67 59 65 46 58 69 85 59 74 81 96 44 55 56 71 50 63
74
- Null Hypothesis: M1 - M2 = 10
- Alternative Hypothesis: M1 - M2 not equal to 10
Select Tools | Data Analysis ... then select t-Test: Two Sample, Assuming Unequal Variance
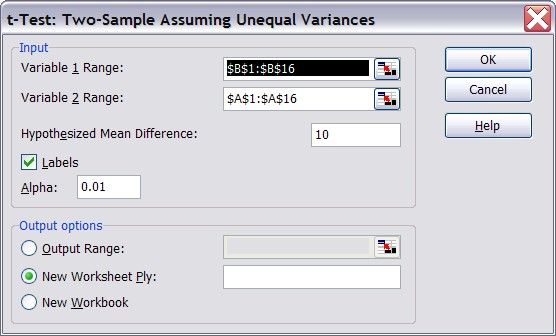
There are several two-sample tests available, for specific situations. A t-test assuming unequal variance is the most general one so select that. You should see a dialog window similar to the following:

Since we picked the "new method" data as variable 1 we need to put the data for the second column in the "variable 1" range and the first column data in the "variable 2" range:
- In the Variable 1 Range: enter the range for the data from the "New" method (column B)
- In the Variable 2 Range: enter the range for the data from the "Original" method (column A)
- In the Hypothesized Mean Difference: enter the number 10
- For the Alpha value: enter the number 0.01
- Make sure to check the Labels box and click on Okay.

