5.3. Crosstabs Tables
In the first part of this chapter we saw how to create row and column percentage tables for categorical variables in Excel if we already know the total counts in the respective categories. In the second part we saw how to use Excel's "Pivot" function to compute such counts or frequencies for us, using one variable at a time. Now we want to automatically generate tables involving two variables from a particular data set instead of converting existing tables into percentage tables. The procedure will be similar to the one before, so make sure you are familiar with the previous section.
Example: Attached is an Excel data file listing salary levels and other information about employees of a particular company. Create and interpret tables relating:
- Gender with Salary Level
- Salary Level with Years of Education
- Salary Level with Job Category
With Excel, the appropriate tool to create such crosstabs tables is - you guessed it - the "PivotTable Report ..." menu item under the "Data" menu. Actually, the PivotTable menu item is still more flexible than we will need in our course, but it will for sure create the type of tables that we will be interested in.
- Load the above spreadsheet into Excel
- Select "PivotTable Report ..." from the "Data" menu entries, as in the previous section.
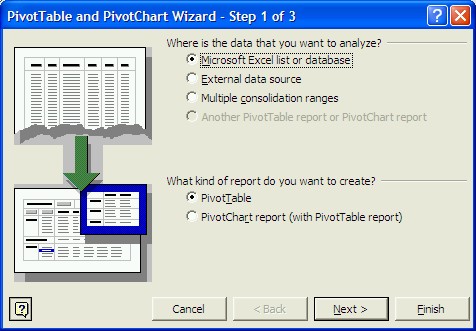
Since we will accept all default options anyway, we can click immediately on "Finish" to skip several questions and jump directly to the heart of the matter. After clicking "Finish" you will see the table familiar from the previous section, where you can drag variables from a floating window into the "Row", "Column", and/or "Data" areas.
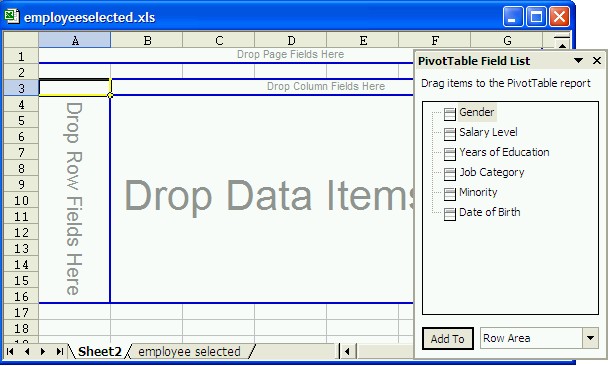
- To analyze the relationship - if any - between "Gender" and "Salary Level", drag the variable "Salary Level" to the "Row" field of the table and the variable "Gender" to the "Column" field (if you accidentally drop a variable in the wrong spot, simply drag it back to the floating window). That will create a table with "Salary levels" as rows and "Gender" as columns, but containing no data yet. Finally, drag either "Gender" or "Salary Level" into the "Data" field in the middle (in our case it does not matter which one but in the picture below we used "Salary Level") and the table will be complete - but with raw data, not percentages.
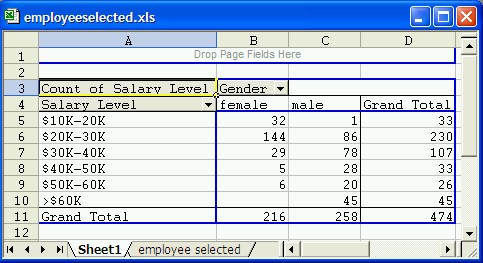
This table shows, for example, that 32 female employees out of 474 total employees earn between $10,000 and $20,000, while, for example, 45 male employees earn more than $60,000.
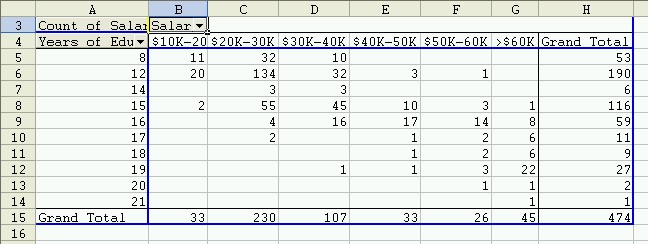
Similarly, we can create tables to relate "Salary Level" with "Years of Education". We could start again from scratch, but since we already have the pivot table available, we can simply drag the "Salary Level" and "Gender" variables out of the table back to the floating window, and drag the "Years of Education" and "Salary Level" to the respective row, column, and data area to create our next table:
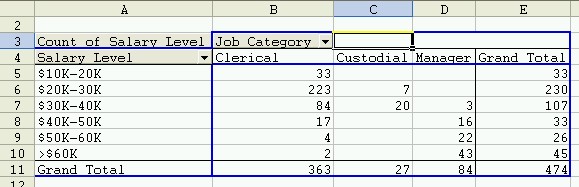
Finally we can create the table relating "Salary Level" with "Job Category". It will look similar to this one:
To finish our discussion on crosstabs tables, let's use the above tables to answer specific questions:
Example: Using the same Excel data as before, answer the following questions:
- How many female employees earn less than $40,000 ? How many males ?
- How many people earning more that $60,000 have 15 years of eduation or less ? How many of those have more than 15 years of education ?
All answers should be in percent.
At first glance it might seem that we have already created the right tables to answer these questions. However, this time we want the answers in percent, while our above tables contain actual numbers. And, as we have discussed in the previous section, when we want to generate percentage tables we need to decide whether we want row or column percentages. Therefore, we first need to discuss exactly which tables to generate to answer these questions before worrying about how to do it in Excel.
To answer question 1, we clearly need to generate a table relating salary with gender. Let's use salary as row variable and gender as column, just as above:
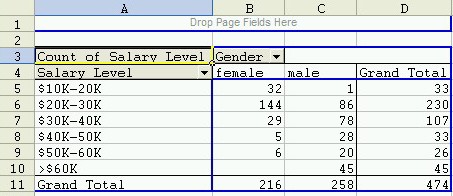
Question 1 uses as total all female employees, and in our table the "females" go along a column. Therefore, we need to generate column percentages in the above table.
- Double-click the "Count of Salary Level" button in your table and click on "Options" in the dialog that pops up. Then select "% of column" in the "Show data as" field and click OK.
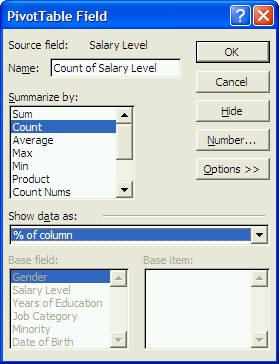
You should see the final table, containing column percentages, as shown below.